

Understand how scheduling tools works-Draw network diagram yourself
All planning engineers and most project managers can create a Gantt Chart (Bar Chart) using different scheduling tools such as Primavera and Microsoft Project. However, only a few of them know how the scheduling software calculates the network diagram to estimate the project duration, project floats, and critical path.
In this topic, we will discuss how any software calculates the network diagram to estimate project duration, float, and the critical path. Using the following figure of the network diagram we will see how the calculation works.

Ready to take your skills to the next level? 🚀 Check out our Special Online Courses! 🚀
Gain valuable insights, boost your career, and learn from industry experts.
Each circle represents a task, and each line between represents the relationship. For example, task S needs to be finished before task A can start. Moreover, tasks B and C should be finished before task F can start, and so on.
First of all, you need to draw a rectangular for each task as per the following figure.
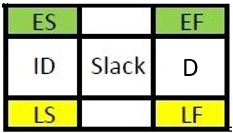
ES = Early start
EF= Early finish
ID = task ID
Slack= Total Float
D= Task duration
LS= Late start
LF= Late finish
If we assumed the duration (D) for each activity as per the following:
Task | Task Duration E |
A  FREE COURSE Primavera Online Basic Course -EnglishOnline Primavera P6 Course for Engineers & Construction Managers Learn how to use Oracle Primavera P6 to plan, schedule, monitor, and control…
| 7 |
B | 11 |
C | 12 |
D | 9 |
E | 2 |
F | 10 |
G | 3 |
H | 2 |
I | 6 |
J | 8 |
To calculate the values for each rectangular (task), you should first fill in the duration (E), and calculate Early Start (ES) and Early Finish (EF).
This process is called Forward Calculation EF = (ES + D) – 1
After you finish all the tasks, from the last one you need to go back and calculate the Late Finish (LF), Late Start (LS), and Total Float (Slack). This process is called Backward Calculation LS = (LF – D) + 1
You should have a shape that is close to the following figure

The Green color represents the Forward Calculation EF = (ES + D) – 1, and the yellow color represents the Backward Calculation LS = (LF – D) + 1
Try to solve this network diagram by yourself, this will help you to develop common sense when you are dealing with scheduling software such as Primavera or Microsoft Project. When you finish, you will be able to find the project’s total duration, which will be founded on task J Early Finish or Late Finish, and you will be able to define the critical Path.
Download the Resources of this Article
Understand how scheduling tools works-Draw network diagram yourself 269.75 KB 1486 downloads

Keep in Touch
Join our Email Newsletters and receive FREE weekly useful content!

Keep growing with Planning Engineer
Learn with a clear path
From Primavera P6 basics to claims, cost control and Power BI. Start with our free courses.
Browse coursesGet help on WhatsApp
Every course comes with a private WhatsApp support group where our team answers your questions.
Join a courseFind planning jobs
27 open planning and project control jobs. Post your resume so employers can find you.
See jobsGet tips by email
Free planning tips, templates and course offers. Unsubscribe any time.
Related posts:




You may also like

How to Minimize Total Float in Construction Activities

